

Articles
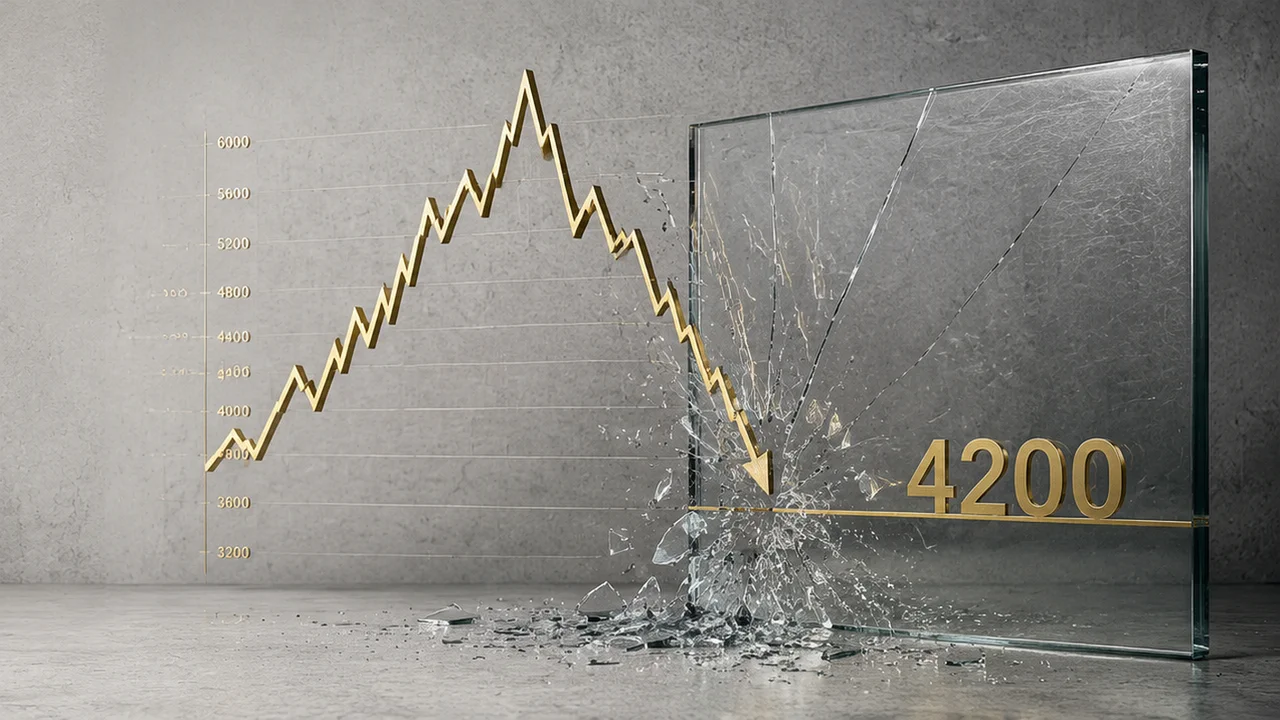
THE PERFECT STORM ON COMEX: GOLD BELOW $4,200 — PANIC OR GIFT?
Today, 10 June 2026, spot gold broke through the psychological $4,200 threshold and set fresh lows in the $4,161–$4,172 range. A classic "perfect storm" of tough US macro data, exchange algorithms and a fading geopolitical premium — yet for physical-metal investors the sell-off exposes the gap between paper speculation and real scarcity.
By Dan Vastrik, 10 June 2026
Today, 10 June 2026, the spot gold market ($XAU/USD$) was swept by a powerful wave of selling. Quotes broke through the psychological $4,200 threshold and set fresh local lows in the $4,161–$4,172 per troy ounce range.
The current decline is a classic "perfect storm," in which tough US macro data, exchange-trading algorithms and a sharp deflation of the geopolitical premium have all converged at a single point. Yet for investors who work with real physical metal, this sell-off exposes a vast gap between "paper" speculation and the genuine scarcity of the raw material.
1. Three Triggers of the Panic: Why Exchange Quotes Fell
Hot US CPI and a Hawkish Fed Pivot
The main catalyst for today's drop was the fresh May inflation report (CPI) in the United States. The annual reading jumped to 4.2% — the highest since the spring of 2023.
Given that last Friday delivered an abnormally strong labour-market report (NFP showed +172k jobs instead of the forecast 80–90k), Wall Street has finally buried any hope of interest-rate cuts in 2026. CME futures now price the probability of an autumn–winter Fed rate hike above 50%. As a result, yields on 10-year US Treasuries surged higher, and the dollar index (DXY) closed in on the 100 mark, dealing a heavy blow to non-yielding precious metals.
The Middle East "Safe-Haven" Sell-Off
The geopolitical premium that kept gold at extreme highs in the spring (against the backdrop of direct strikes between Israel and Iran and escalation in the Strait of Hormuz) began to evaporate rapidly. The market is digesting behind-the-scenes news that the acute phase of the confrontation has been paused and that Washington is close to a compromise with Tehran. As soon as the fear of an immediate energy and oil shock subsided, large speculators began aggressively closing their protective hedge positions in the metal.
A Cascade of Stop Orders and a Break of the 200-Day SMA
From a technical standpoint, gold had long held a fragile sideways range, but today the domino effect kicked in:
- A clean break of key support at the $4,280 level (last October's highs) was recorded.
- The price finally moved below the 200-day simple moving average (SMA), which had acted as the main watershed of the long-term "bullish" trend.
The move below the 200-day SMA forced algorithmic funds and large market makers to close long positions en masse on stop orders. This triggered an avalanche-like drop of more than 2% in a single trading session (the cumulative pullback from the spring records has already reached roughly 9%).
2. What Is Important to Add: Hidden Factors in Favour of the Metal
To form a complete picture of what is happening, three fundamental insights that Wall Street is overlooking need to be added to the current market situation:
The Shanghai Premium Factor (The Gap Between Paper and Physical)
While the New York COMEX exchange sees a panicked dumping of futures contracts, physical demand in Asia is showing an entirely different dynamic. During such "paper" sell-offs, the physical premium to the London spot price traditionally surges on the Shanghai Gold Exchange (SGE) (the arbitrage reaches $30–$50 per ounce). Chinese and Indian dealers use this slump for large-scale purchases of the cheaper raw material.
Historical Seasonality: The June "Summer Lull"
Today's collapse fits perfectly into gold's 50-year seasonality matrix. June is historically the weakest month of the year (Summer Lull), when trading volumes fall and large funds go on holiday, forming an absolutely ideal seasonal bottom for a long-term entry.
The Industrial AI Floor (Utility Floor)
Beyond its monetary function, gold is rapidly gaining weight in the real economy. Building the infrastructure for artificial intelligence and next-generation data centres requires record volumes of ultra-high-purity gold plating for microchips. This non-monetary demand creates a rock-solid price floor that will not allow the metal to fall below the cost of production, which (AISC) already exceeds $1,550 per ounce.
3. Institutional Demand and the Technical Map
For long-term investors building positions in physical bars and investment coins, the current clearing of speculative "fat" from the market is a strategic opportunity, because the long-term systemic risks of the fiat system have not gone anywhere (US national debt is approaching $40 trillion).
The People's Bank of China (PBoC) confirms this vector: May was the 19th consecutive month of official gold purchases into the reserves of the PRC. The countries of the DACH region (Germany and Austria), drawing on their ancestors' historical memory of hyperinflation, are also using the current discount to build up physical volumes in private safes.
Strategic Levels and Benchmarks
| Level / Support Zone | Market Scenario | Tactical Significance |
|---|---|---|
| $4,080 – $4,150 | Current zone of strong buyer interest. | Consolidation phase, stabilisation after the cascade of stops. An ideal window for planned dollar-cost averaging (DCA). |
| $4,000 | A rock-solid psychological threshold. | A test of the round number is possible only if Treasury yields rise further, above 5%. |
| $5,200 – $6,000 | The long-term target benchmark of major investment banks (J.P. Morgan / Goldman Sachs) for the end of 2026 — 2027. | A resumption of the global bullish trend after the inflation cycle in the US stabilises and rate cuts begin. |
Summary: Today's slump is a painful but technically healthy unloading of an overheated futures market. The physical foundation of gold remains intact. Current levels around $4,160 offer investors the most comfortable and safe entry point since the start of 2026.
Disclaimer: This analytical review is provided for informational purposes only and does not constitute personal investment advice. Conducting your own analysis (DYOR) is mandatory.