

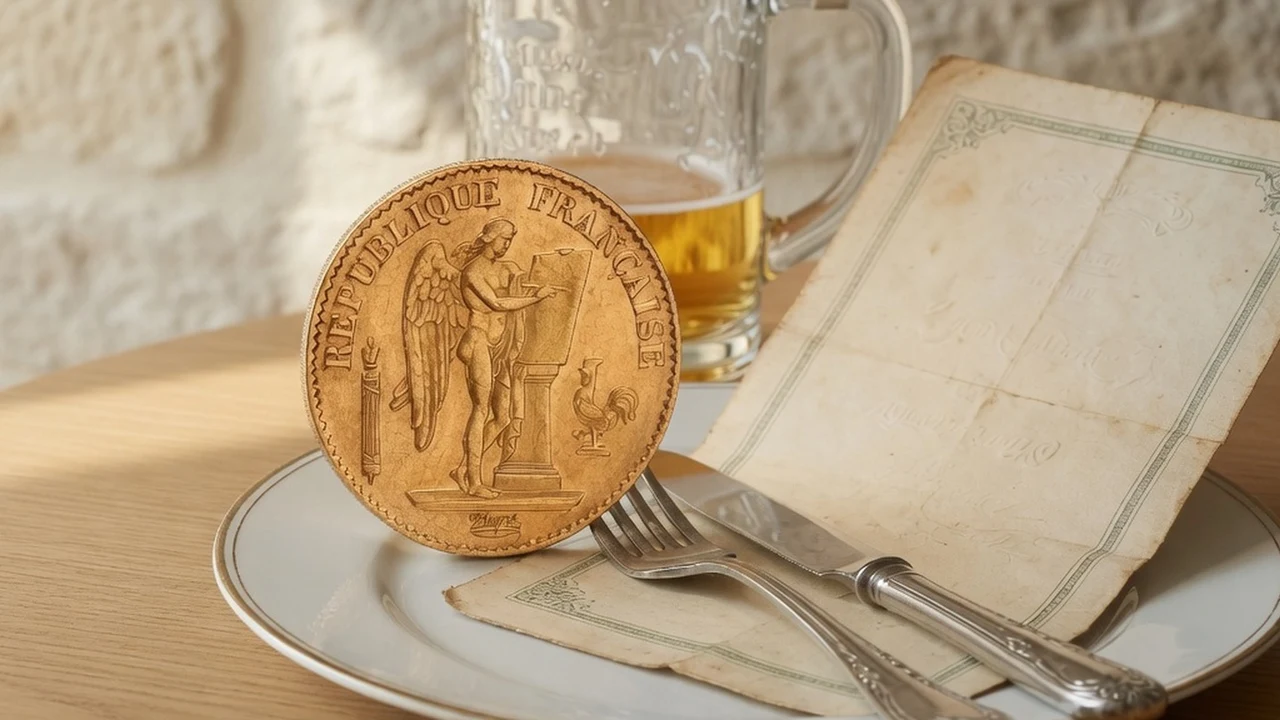
On 19 August 1971, London's Savoy Grill served a dinner whose menu has survived to this day—prices included. Four days earlier, President Nixon had announced that the dollar would no longer be convertible into gold. An ounce was then worth about $40, or £16.66, enough to pay for three dinners at the Savoy.
By Dan Vastrik, 19.07.2026
On 19 August 1971, London's Savoy Grill served a dinner whose menu has survived to this day—prices included. Four days earlier, President Nixon had announced that the dollar would no longer be convertible into gold. An ounce was then worth about $40, or £16.66, enough to pay for three dinners at the Savoy.
In January 2026, the team at investment manager Equitile found that same menu and repeated the measurement. The bill came to £236.32 per person. At the price on the day—about $4,460—an ounce of gold paid for almost fourteen such dinners (Equitile's exact figures were 2.94 and 13.98).
Over the same 54 years, the pound lost about 97% of its purchasing power.
I like this measurement because it cannot be massaged. Here is the menu. Here is the bill. Everything else is arithmetic.
The Savoy Index: Fifty Years Measured in Dinners
The idea came from London investor Julian Baring in the 1970s: measure gold's value not in pounds but in dinners, making it easier to see what was actually losing value. In 2026, George Cooper, Equitile's chief investment officer, revived the index.
The dinner itself became 41 times more expensive over those years. That equates to roughly 7.1% annual inflation—well above the Bank of England's official 2% target.
But the more interesting comparison is with the average British weekly wage. Measured in labour, the dinner barely changed: about 1.4 days of work in 1971 and around 1.6 days today. Three rulers were used to measure the same meal. In wages, the price stayed similar. In pounds, it rose 41-fold. In gold, it became four times cheaper. The real question is which ruler kept the same length over half a century.
The authors themselves add an important caveat, and it should not be hidden. Equitile does not claim that gold is now “cheap” or that today's price is “correct.” Its single starting point, 1971, was abnormally low—that was precisely why Nixon had to devalue the dollar. The index shows a direction, not a verdict.
The Oktoberfest Index: Beer as an Impartial Measure
Since the 2010s, Liechtenstein-based Incrementum AG has made a second annual measurement: how many litre mugs (Maß) of beer at Munich's Oktoberfest one ounce of gold can buy.
In 2023, the answer was 119 mugs. In 2024, it was 148. At Oktoberfest 2025, it reached 186—one hundred and eighty-six litres of beer for a coin weighing 31 grams.
Beer can hardly be described as a falling-price product. A mug cost as much as €15.80, up 3.3% in a year, while food prices in Germany had risen by about 32% since January 2021. Beer outpaced official inflation, yet still lost ground to gold: over two years, the ounce became “heavier” by 67 mugs, an increase of 56%.
The index is playful in form but serious in substance. It challenges the familiar claim that gold is “dead weight” that barely keeps pace with prices. The next measurement will come at Oktoberfest 2026.
Bread and a Suit: Popular Indices, with an Honest Note on Their Status
Two other illustrations circulate from article to article, and candour is needed: these are not rigorous data series but popular comparisons. Their value lies in the order of magnitude, not precision down to the last loaf.
The bread comparison holds that an ounce of gold bought several hundred loaves both in Babylon and ancient Rome—roughly the same order of magnitude as today. The exact claim of “precisely 350” should be treated as an attractive legend: bread quality, loaf weight and prices across millennia are not comparable. The broad order—hundreds of loaves then and now—does endure.
The suit comparison says that in 1923 an ounce was worth $20.67 and bought a bespoke men's suit. Today an ounce costs several thousand dollars and still covers a suit of comparable quality. It is an elegant rhyme across a century—but a rhyme, not a dataset.
What an Ounce Buys: The Full Picture
| Indicator | In the past | In 2026 | Status of data |
|---|---|---|---|
| Dinners at the Savoy Grill | ~3 (1971) | ~14 (2026) | Equitile measurement using the menu and bill |
| Oktoberfest mugs | 119 (2023) | 186 (2025) | Annual Incrementum index |
| Bespoke suit | 1 ounce (1923) | ~1 ounce (2026) | Illustration, not a data series |
| Bread (order of magnitude) | hundreds of loaves (antiquity) | hundreds of loaves (2026) | Popular illustration |
| Pound sterling (cash) | 100% (1971) | ~3% (2026) | Loss of purchasing power over 54 years |
Key Factors
Why does gold behave like a constant ruler rather than an ordinary commodity?
- Limited supply. The global stock of gold grows by only 1.5–2% a year through mining, and no regulator can accelerate that rate.
- No issuer. Gold has no central bank that can create more of it. The length of the fiat ruler can be changed by a decision; the length of the gold ruler cannot.
- A technology dividend. Over a century, the labour needed to produce bread, beer and suits has fallen dramatically, yet their price in gold has held broadly steady. A common interpretation is that monetary inflation absorbs the gains from progress. That is an interpretation, not an established fact.
Conclusion
The Savoy, Oktoberfest and—with due caveats—the suit and bread comparisons show the same thing from different angles: measured in real goods, gold's purchasing power persists over decades and rises during periods of currency stress. An honest framework remains essential. Gold does not “always rise”: in fiat terms it has suffered multi-year declines, and the authors of the Savoy index themselves refuse to call today's price either correct or excessive. The point is another characteristic—gold can serve as a unit of measurement whose length no one can alter by decree.
The test can be repeated next year, in exactly the same way: menu, bill, scales.
This material is for educational purposes only and is not investment advice. Prices of all assets, including gold, can move in either direction, and past performance does not guarantee future results.
In Brief: Frequently Asked Questions
Does gold really preserve purchasing power? Over long periods, measured in real goods, it has. Equitile's Savoy index shows gold's purchasing power increasing roughly 4.7-fold since 1971, while Incrementum's Oktoberfest index shows a 56% increase in beer terms between 2023 and 2025. Gold can still decline for years in fiat terms: this is long-term preservation of value, not a guarantee of gains.
What did an ounce of gold cost 100 years ago? In 1923, about $20.67 per ounce. A common illustration says that was enough to buy a high-quality bespoke suit—much as an ounce costing several thousand dollars can today.
What is the Savoy Gold Ratio? It is a playful but serious metric measuring how many dinners at London's Savoy an ounce of gold can buy. Julian Baring devised it in the 1970s, and Equitile revived it in 2026. The figures are about three dinners in 1971 and about fourteen in 2026.
Does gold always rise? No. Over short and medium periods, its currency price moves in both directions and has experienced multi-year declines. What has remained more durable over long horizons is its purchasing power in real goods, not a constantly rising cash price.
Sources
- Equitile Investments. The Savoy Gold Ratio — gold's purchasing power measured against the Savoy Grill's 1971 menu and a 2026 bill.
- Incrementum AG. O'zapft is! The Gold/Oktoberfest Beer Ratio 2025 — the “ounces of gold in beer mugs” index.
- World Gold Council / GoldSilver. Purchasing Power Over Time — historical series on the purchasing power of gold and fiat currencies.
- Historical comparisons involving bread and suits are presented as popular illustrations, not rigorous datasets.